
Welcome to the Future of TrafficGuard: Introducing Our New Dashboard

👋 Hey there, TrafficGuard community!
We’re beyond excited to share some game-changing news with you. Our new TrafficGuard Dashboard isn’t just a refresh—it’s the dawn of a brand-new era for our platform. Starting in June 2024, we’re rolling out this revolutionary upgrade to our enterprise customers, with a complete rollout by the end of the year.

Why our new Dashboard is a big deal
Our TrafficGuard Protection Graph is a true game changer. Previously, when customers switched from Detection to Prevention mode, they saw a significant drop in their Invalid Traffic (IVT) rate. While this was fantastic for reducing wasted ad spend, it was challenging to show just how much value we were providing. It’s like the “Observer Effect” in physics—the very act of preventing IVT made it hard to measure what wasn’t happening.
Up until now, in order to measure our impact, we had to turn off Prevention mode, letting bad traffic through just to see what we were blocking. Obviously, that wasn’t ideal. But now, thanks to our expanding customer base and the brilliance of our data scientists and engineers, we’ve solved this problem. By analysing data from customers in both Detection and Prevention modes, we can now build models that show the relationship between Detection and Prevention IVT rates. They also allow us to deduce what your Detection rate would have been if you weren’t using Prevention.
A closer look at the TrafficGuard Protection graph
With the new Dashboard, you can see a Detection Rate (yellow line) and a Prevention Rate (blue line). The difference between these lines, shown in green, represents the IVT we blocked and the ad budget we saved you. It’s a clear, visual representation of the value TrafficGuard provides every single day.

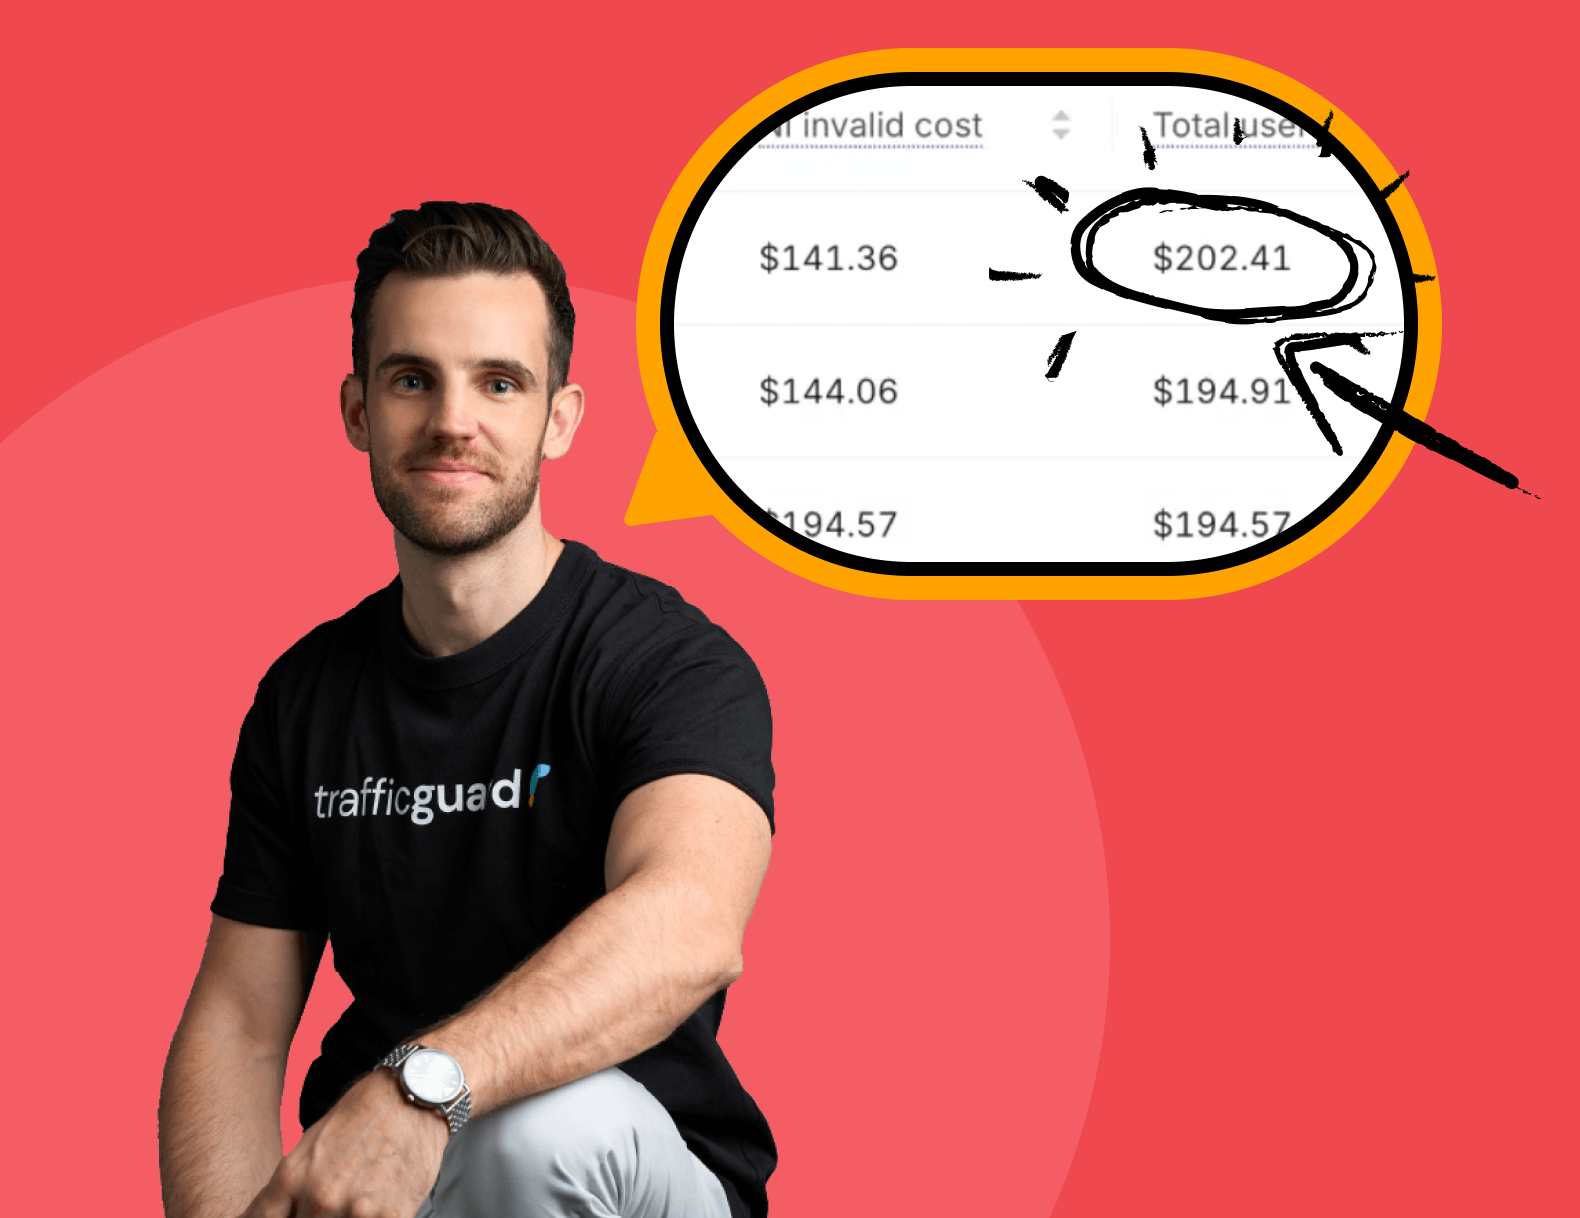
Topline Widgets: See Your Savings at a Glance
Our new topline widgets give users three different ways of quantifying the impact TrafficGuard protection has had on their ad campaigns with values reflecting the time period selected by the user.

Total Budget Rescued: This widget shows how much ad budget we’ve saved you by blocking IVT. It’s calculated by multiplying the IVT clicks we blocked by the appropriate cost per click from Google. Simple, but powerful!
More Chances to Convert: Using our site tag and conversion event tracking, this widget estimates how many additional conversions you could achieve if you reinvested the saved budget into valid ad traffic. More savings mean more opportunities for success.
Business Exposure Mitigated: This “what if?” widget shows the potential cost if every blocked IP had clicked just one more time. It’s a great way to understand the broader impact of our protection.
Looking Ahead: More Exciting Features on the Horizon
While our new Dashboard is a significant leap forward, we’re not stopping here. We’ve got a packed roadmap of exciting features lined up that will keep delivering value well into 2025 and beyond. So, stay tuned, and watch this space!
We’re thrilled to bring you these advancements and can’t wait to hear your feedback. Here’s to smarter, more efficient ad protection with TrafficGuard!

Get started - it's free
You can set up a TrafficGuard account in minutes, so we’ll be protecting your campaigns before you can say ‘sky-high ROI’.

Explore More Blogs

Subscribe
Subscribe now to get all the latest news and insights on digital advertising, machine learning and ad fraud.


